Polyimide Film Lamination - Process Development
This is one of the biggest projects I have tackled in my engineering career thus far. When I first started working at Vacuum Process Engineering, I was doing a lot of production work. As my projects began to wrap up, I was looking for more work to fill the void I had. After speaking with one of our project managers, he said he needed help getting this developed since our customers had been asking for it for a long time.
Polyimide Film is a material used in the semiconductor industry. It is desirable for electronics manufacturing because it acts both a thermal and conductive insulator. There are many different brands of polyimide film, the most notable being DuPont’s version called Kapton. My task was to develop and validate the entire manufacturing process. We were applying this material to parts we were making in house, but beforehand we would send them out to be laminated.
I developed a Manufacturing Flow of how the parts would move through the room, the tests we would conduct on the finished parts, and tried to make everything as efficient as possible. Since it was just in a development stage, continuous improvement was considered but would not be implemented until after I had proved out the process.

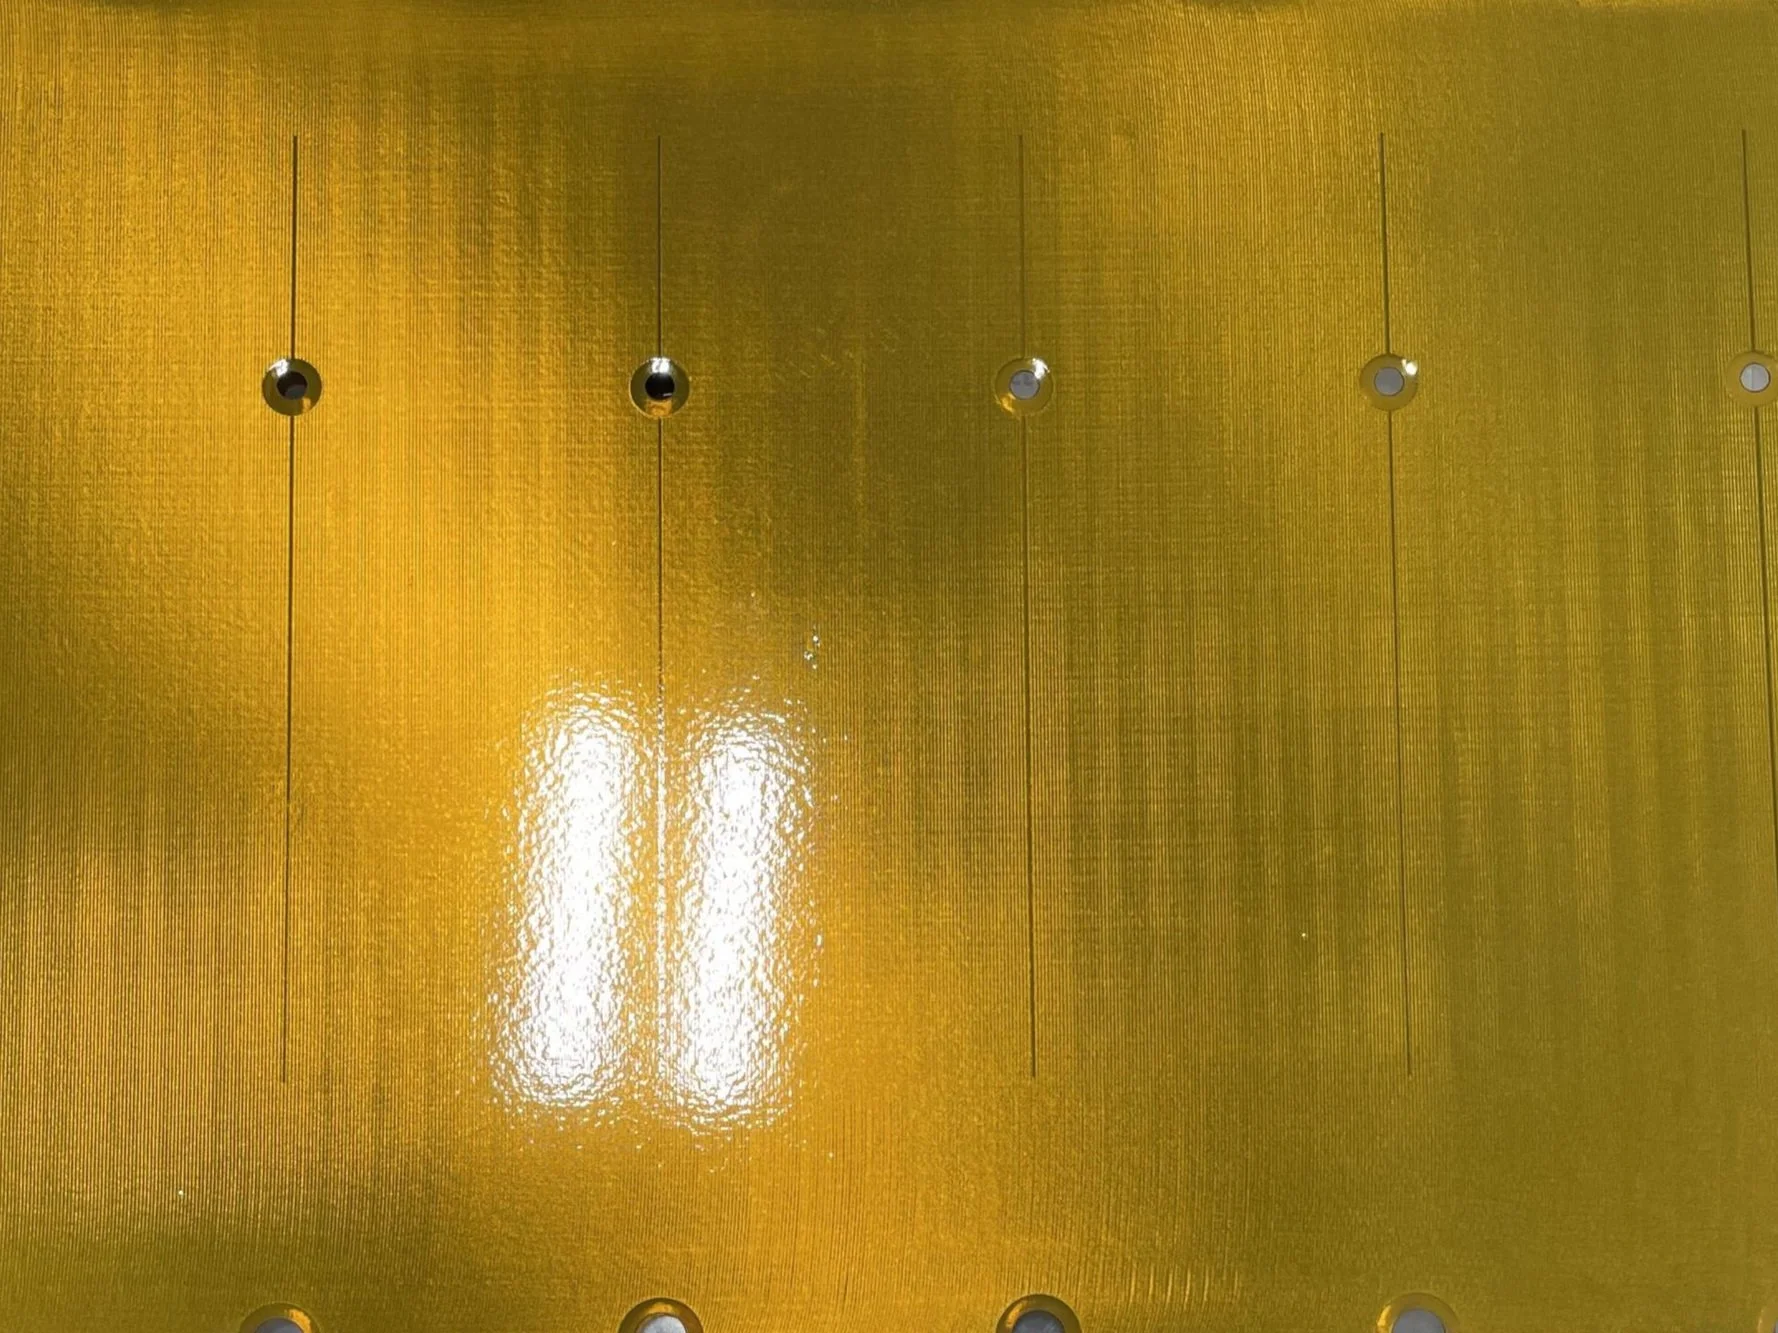
Pinhole Checking
To start our process, we began with a large roll of polyimide film which we would cut into rectangles. Each rectangle was then held up to a powerful light and checked for pinholes. Any pinhole in the surface of the film would cause a poor result in the post lamination tests and reworking the parts was time consuming.
I implemented production checks in my process. So after the rectangle we would check for pinholes, then they would go into storage. The next production technician would remove them from storage and check them for pinholes before loading them into the laser cutter for final template cutting. After the laser cut then they would check again to ensure no pinholes were present. By implementing 3 checks in a row, we were improving our chances of success greatly.
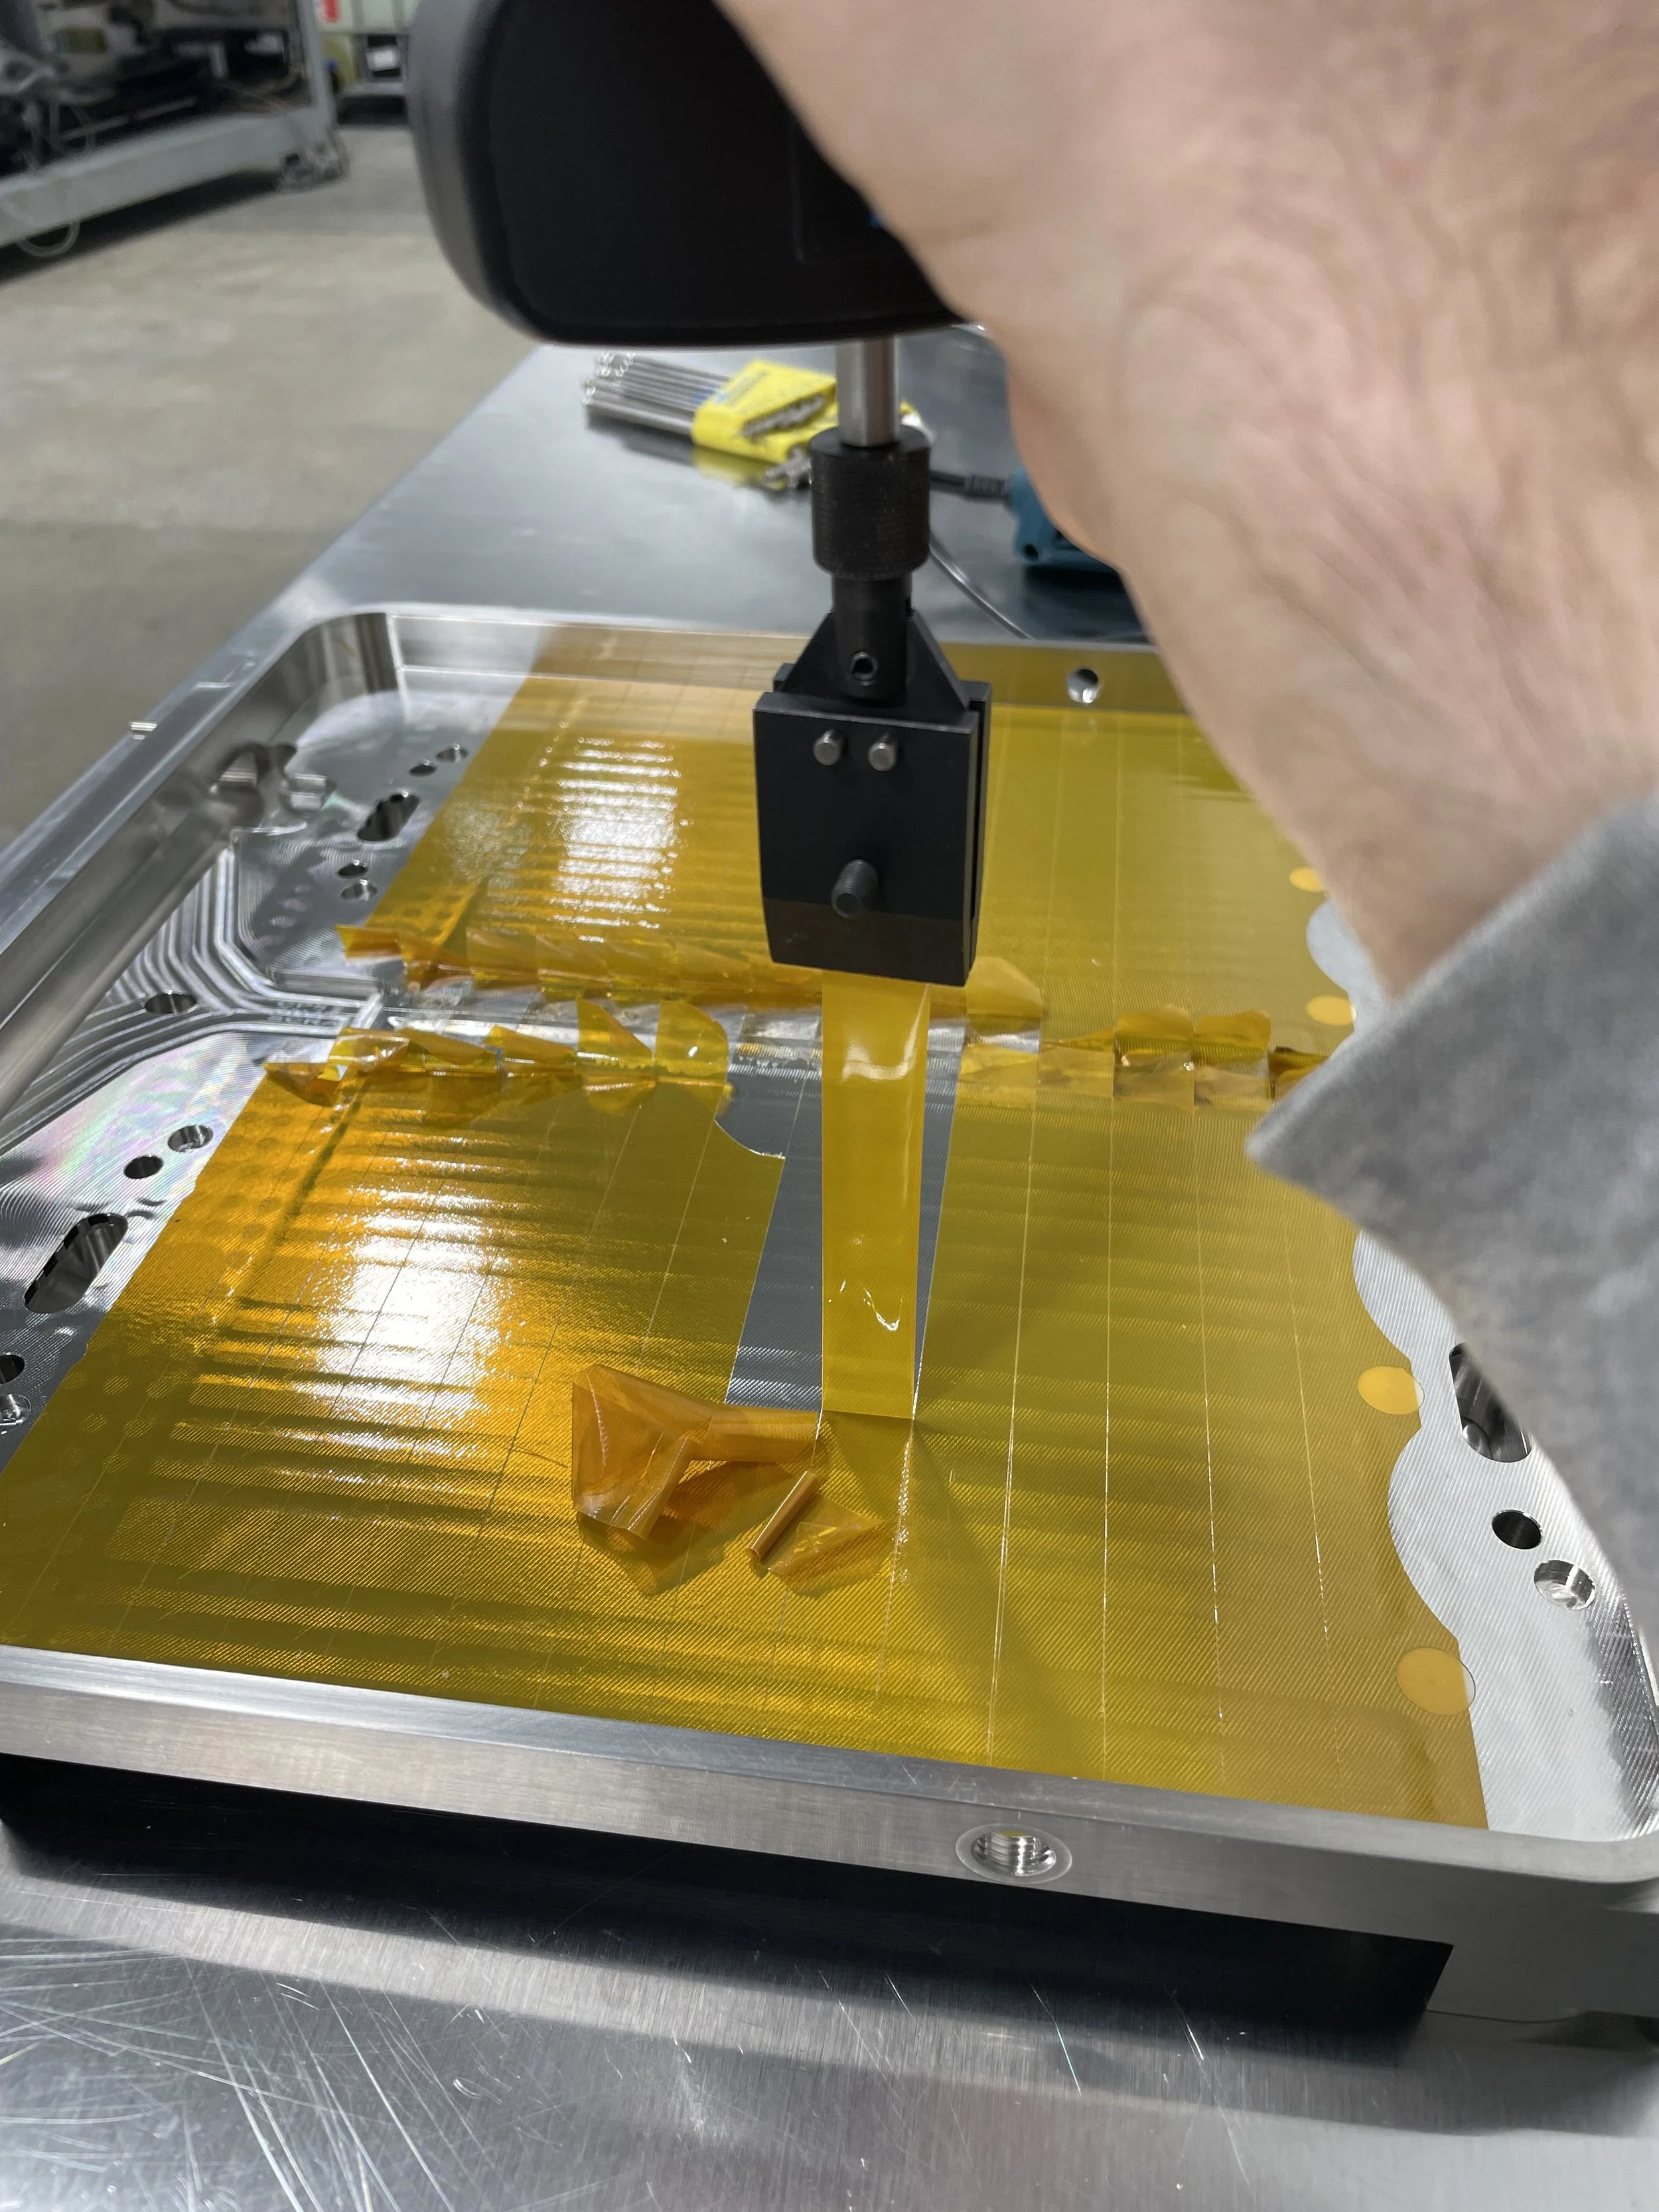
Lamination
The parts were then loaded into a custom furnace designed for our application. The furnace operation was also developed and validated by me and a colleague to ensure the parts were brought to the correct temperature for the correct amount of time.
In the beginning the furnace needed quite a lot of work. The setup involved heater cartridges embedded into aluminum plates. Originally the furnace was designed to use the thermocouples built into the heater cartridges but when I took on the project I realized that was a very ineffective way to heat up the parts. I then asked our furnace build team to move the control thermocouples to ones that would plug directly into the aluminum plates. After doing the calculations for heat transfer, I estimated that the parts would track the heat of the aluminum plates almost perfectly.
Afterwards, it was just a matter of developing a thermal profile for my operation and tuning the PID values on each of the controllers. I used the auto tune function on the controllers to achieve this. I do know the basics of PID tuning, but auto tuning is a much more effective way since each controller would have their own unique error amounts that they needed to correct for and it can be done quickly.
Bond Strength Validation
After lamination, the parts were then tested for a number of criteria. The first criteria was cleanliness. These parts had to be Molecular and Particulate Grade 3 or better. I developed a method for cleaning the parts after bonding to ensure they met that cleanliness level.
The second criteria was HyPot testing. The parts had to be able to insulate from a specified voltage and we had a specific ramp up rate given to us by our customer. For our test I had a custom copper diode machined that fit over the laminated section of the part.
The third criteria was bond strength. Because this test was destructive I did this at the end of all the other tests. I used a Chatillon Force Gauge to create a plot of bond strength across a sample size of 26 strips.
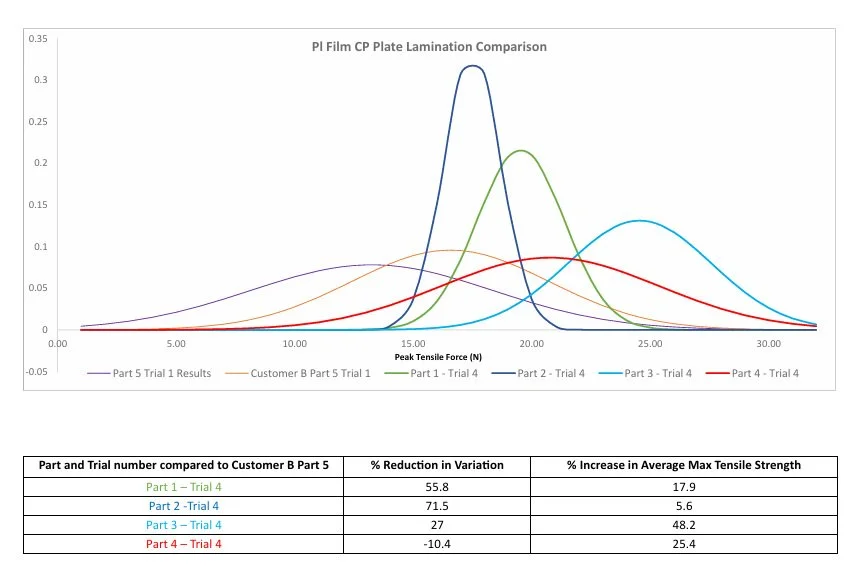
Data Analysis and Verification
The Pull test data was then analyzed in a custom Excel Spreadsheet that I made. I took the data and created a normal distribution of it. Then for each trial as I began tweaking different things with the thermal profile. I would analyze the data and see what produced the best results.
The goal for us was to beat “Customer B”, the light orange curve. I was looking for a distribution within 3 standard deviations and peel strength greater than 0.7 N/mm. After each trial I analyzed our results against Customer B’s part and created a percentage increase in Maximum Tensile Strength and a percentage reduction in variation.